Independent research reference
Dock to Stock Time: Definition, Formula, and Benchmarks (2019–2026 Data)
How to cite this page
Cincinnati Dock Door Repair Research. “Dock to Stock Time: Definition, Formula, and Benchmarks (2019–2026 Data).” https://cincinnatidockdoorrepair.com/research/dock-to-stock-time/. Last updated: September 12, 2026.
What are the key dock-to-stock statistics?
15.0 hours is the median in APQC’s public dock to stock time benchmark for an All Companies sample of 3,560. This is a peer-group median of companies’ average supplier-delivery cycle times, not the median of 3,560 individual receipts; collection vintage is not displayed. Source: APQC measure 100677; verified September 12, 2026. 1
Under 3.5 hours is the 2025 WERC best-in-class cutoff reported in Yale’s summary, representing the fastest-performing fifth rather than a universal target. It is a half hour above the 2024 cutoff; Yale describes that change as the largest performance decline among the report’s top 12 metrics. Sources: Yale’s 2024 and 2025 WERC summaries; verified September 12, 2026. 6 8
75% higher from the 2019 to 2025 report: the published WERC cutoff rose from under 2 hours to under 3.5 hours across seven report editions. That is a calculation on the cutoff values, not a measurement that the same facilities became 75% slower; no 2026 time value was disclosed in the public release inspected. Source: Cincinnati Dock Door Repair Research’s annual-summary compilation, September 12, 2026. Table 2
Among the five most popular of 36 metrics: WERC’s May 16, 2026 release includes dock-to-stock in that group and places it second in a list, without explicitly giving it second-place rank. Yale’s summaries show #5 in 2025, #3 in 2024, and #11 in 2023. Sources: WERC and Yale; verified September 12, 2026. 3 6 8 9
44.1 hours is the top-to-bottom performer spread reported in APQC’s March 2, 2017 dock-to-stock column. This historical spread is not calculated from the current 15-hour median or its displayed sample. Source: APQC’s producer-authored column in Supply & Demand Chain Executive; verified September 12, 2026. 2
9 of 23 numerical evidence records in this register are direct benchmark pages or producer/sponsor summaries from two benchmark programs, APQC and WERC. The other 14 are practitioner statements, vendor assertions, attributed restatements, or provider service statements—not 14 independent warehouse samples. Source: Cincinnati Dock Door Repair Research’s selected-source ledger, September 12, 2026. Table 1
8 of 20 definition passages explicitly name an inventory-system or recorded-event requirement; 5 imply a stock-availability state and 7 name only a physical endpoint under this reference’s coding rule. These are passage classifications, not a claim about everything those publishers say elsewhere. Source: Cincinnati Dock Door Repair Research’s definition census, September 12, 2026. Table 5
2 of 20 inspected sources explicitly state that waiting belongs in the cycle-time calculation under the census rule: APQC and s2bi’s explanation citing APQC. A timestamp formula alone was not counted as an explicit statement about waiting. Source: Cincinnati Dock Door Repair Research’s definition census, September 12, 2026. 1 24 Table 5
8–10 hours, 12–24 hours, and up to 48 hours are the best-in-class, midsize, and 3PL practitioner ranges attributed to Brian Barry in ISM’s January 30, 2023 interview. The same consultancy’s undated guidance pages give best-in-class ranges of 2–6 and 2–8 hours, without displaying sampled distributions. Sources: ISM and F. Curtis Barry & Company; verified September 12, 2026. 16 17 18
2 business days is Red Stag Fulfillment’s published dock-to-stock service statement on its East Coast page; a separate guarantees page describes receiving in as little as 1 hour. These are a service statement and a best case, not measured averages; publication dates are not established for the inspected pages. Source: Red Stag Fulfillment; verified September 12, 2026. 40 41
489 responses is the new-response count in WERC’s 2019 study, which pooled those responses with 2018 responses and asked in January 2019 about prior-year performance. It is not the dock-to-stock-specific sample size and does not establish the observation period for every later report. Source: WERC’s 2019 Snapshot handout; verified September 12, 2026. 4
3 receipt routes; 1 transaction for direct receipt: Oracle Receiving 26B documents direct, standard, and inspection routes, with receipt and automatic system putaway combined in direct routing. A combined transaction is not a measurement of how long goods physically took to move. Source: Oracle Receiving 26B; verified September 12, 2026. 36
Physical stock is not necessarily usable stock: Microsoft’s July 1, 2026 inventory-status documentation says blocked inventory can count as physical inventory while remaining unavailable for sales, transfers, production, and other outbound transactions. Source: Microsoft Learn, Dynamics 365 Supply Chain Management; verified September 12, 2026. 37
7,650 shipping, receiving, and inventory clerks is BLS’s employment estimate for the Cincinnati, OH-KY-IN metro in May 2025, with location quotient 1.32 and mean wage $22.15 an hour; cargo and freight agents have location quotient 2.22. These are workforce estimates, not receiving-speed measurements. Source: BLS, released July 20, 2026; verified September 12, 2026. 44
6th in North America and 12th globally are CVG Airport’s stated cargo rankings for 2023. Its cargo page also identifies Amazon’s primary U.S. Air Hub and DHL’s Global Super Hub for the Americas; the 2023 ranking is not a 2026 ranking. Source: Cincinnati/Northern Kentucky International Airport; verified September 12, 2026. 47
By Cincinnati Dock Door Repair Research · Last verified: September 12, 2026 · Dataset version: 2026-09-12
The two benchmark programs at the center of this reference answer different questions. APQC’s public measure shows a 15.0-hour company-level median; Yale’s summary of WERC’s 2025 report gives an under-3.5-hour best-in-class cutoff. One cannot be used to calculate how much faster the other population is. This page reconciles 23 numerical evidence records, adds the 2026 WERC release without guessing its undisclosed value, and shows which clock each source describes. 1 3 6
The original evidence asset is the joined benchmark ledger, annual-report crosswalk, and 20-passage definition census. Its receiving log separates physical arrival, inventory posting, putaway, and availability rather than treating them as one event. It does not present a new warehouse survey, a national average, or a local performance estimate.
Contents: Key statistics · What it measures · What is a good dock-to-stock time? · The WERC series · What this shows and does not · How the evidence was assembled · How to calculate it · Why published figures disagree · The process and where it loses time · Ohio and Hamilton County · Why it matters now · Limitations · How to cite · Dataset download · Questions and answers · Sources
What does dock to stock time measure?
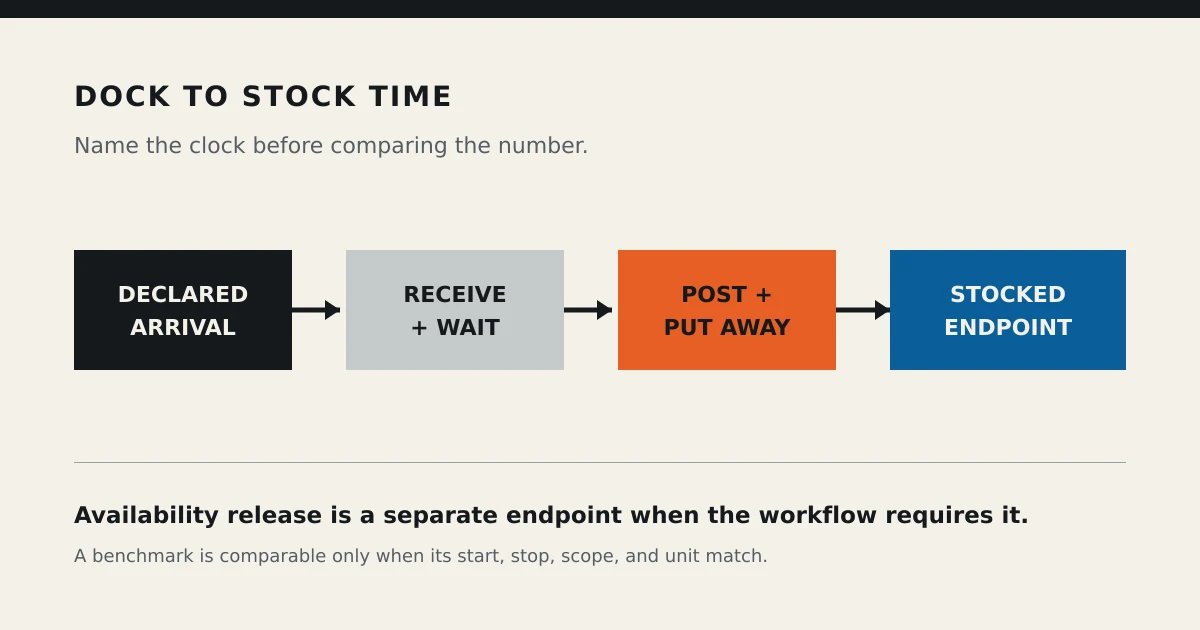
Dock-to-stock time measures the elapsed time from a declared inbound-arrival event to a declared stocked-inventory state. APQC’s definition includes inventory recording and putaway, and expressly includes waiting; Yale’s WERC summaries also require putaway and an inventory-system record. Availability for an order is a separate endpoint in some definitions and systems, so it must not be silently substituted for physical putaway. 1 6 21 37
The receiving window can contain unloading, staging, verification against the purchase order or advance ship notice (ASN), receipt posting in the warehouse management system (WMS), and putaway. Some operations add inspection, exception handling, or release from a hold. An ASN is advance shipment information supplied before receipt; the cited practitioner guidance discusses both paper and electronic forms, so its presence does not necessarily mean an automated system integration. 17 20 36
Two words carry most of the measurement disagreement:
“Arrival.” This reference’s log starts when the delivery reaches the receiving dock, not when unloading begins and not when a clerk opens a receipt on screen. Waiting after that declared start belongs in elapsed time. Yard or gate waiting before dock arrival belongs in a separately named gate-to-stock or yard-wait measure unless the operation deliberately declares gate arrival as its start; APQC’s general receipt wording does not, by itself, settle every facility’s gate-versus-dock boundary. 1 25
“Stock.” The APQC and WERC-summary wording requires an inventory record and completed putaway, but does not explicitly specify the downstream availability-release event used by every WMS. Seven of the 20 selected definition passages name only a physical endpoint, while others name availability or a system event. The definition census preserves those distinctions rather than assuming all uses of “stock” mean the same thing. 1 6 37
Dock-to-stock cycle time and DTS are common labels in the inspected material. “Receiving lead time” is less precise without its own start and stop definition. A useful measurement contract names the actual start event, physical completion event, system event, time basis, and unit of observation before any comparison is made. The proposed contract below does that without claiming either benchmark producer endorses this exact log. 16 35
What is a good dock to stock time?
The defensible answer has two reference points and one boundary: APQC displays a 15.0-hour company-level median, while Yale reports WERC’s 2025 best-in-class cutoff as under 3.5 hours. These are different statistics from different respondent populations, not the middle and fastest fifth of one combined distribution. A useful target matches the operation’s receipt type, inspection requirements, clock, and denominator; neither figure makes one universal pass/fail threshold. 1 6 36
The table keeps the numbers as the sources present them. A consultant’s range, a vendor’s target, a survey summary, and a provider’s business-day service statement can all be accurately transcribed without becoming interchangeable evidence. “Sample not disclosed” means the inspected document supplies no sampled basis for that assertion; it does not establish that the publisher has never collected data.
Verification marks: ★ means the statement or source metadata was checked against the issuing organization’s or original publisher’s material. For an attributed practitioner or vendor statement, the mark verifies the attribution—not the assertion as a measured fact. ● means an identified summary or reproduction was inspected, but the underlying full benchmark report was not. Neither mark certifies warehouse performance.
Table 1. Dock-to-stock benchmark and service-statement ledger: 24 evidence records
| # | Source (date) | Evidence type | Figure as published | Basis | Clock: start → stop | Mark |
|---|---|---|---|---|---|---|
| 1 | APQC — Undated; inspected 2026-09-12 1 | Survey benchmark | Median 15.0 hours; All Companies | Sample displayed: 3,560 companies; collection period not displayed | Supplier delivery received → Put away after inventory recording; waiting included | ★ |
| 2 | APQC — 2017-03-02 2 | Producer-authored survey summary | 44.1-hour top-to-bottom performer spread | Historical APQC summary; sample size not stated | Supplier delivery received → Inventory recorded and put away | ★ summary |
| 3 | WERC via Yale/Riekes — Report year 2019; exact summary publication day not established 13 4 | Survey summary | Best-in-class < 2 hours | 2019 study: 489 new responses plus 2018 pooled; metric-specific count not given | Arrival of goods → Put away and recorded in inventory system | ● threshold / ★ 2019 method |
| 4 | WERC via Yale — Report year 2020; exact summary publication day not established 12 | Survey summary | Best-in-class < 2 hours | Metric-specific sample size not disclosed in inspected summary | Arrival of goods → Put away and recorded in inventory system | ● |
| 5 | WERC via Yale — Report year 2021; exact summary publication day not established 11 | Survey summary | Best-in-class < 2.144 hours | Metric-specific sample size not disclosed in inspected summary | Arrival of goods → Put away and recorded in inventory system | ● |
| 6 | WERC via Yale — Report year 2022; exact summary publication day not established 10 | Survey summary | Best-in-class < 3 hours | Metric-specific sample size not disclosed in inspected summary | Arrival of goods → Put away and recorded in inventory system | ● |
| 7 | WERC via Yale — Report year 2023; exact summary publication day not established 9 | Survey summary | Best-in-class < 3 hours | Metric-specific sample size not disclosed in inspected summary | Arrival of goods → Put away and recorded in inventory system | ● |
| 8 | WERC via Yale — Report year 2024; exact summary publication day not established 8 | Survey summary | Best-in-class < 3 hours | Metric-specific sample size not disclosed in inspected summary | Arrival of goods → Put away and recorded in inventory system | ● |
| 9 | WERC via Yale — Report year 2025; exact summary publication day not established 6 7 | Survey summary | Best-in-class < 3.5 hours | Metric-specific sample size not disclosed in inspected summary | Arrival of goods → Put away and recorded in inventory system | ● |
| 10 | WERC — 2026-05-16 3 5 | Survey-edition context | Dock-to-stock among top five; numerical threshold not disclosed in release | 2025–2026 surveys; 36 metrics; 17.2% of respondents outside North America | Not specified in release → Not specified in release | ★ release |
| 11 | F. Curtis Barry & Company via ISM — 2023-01-30 16 | Practitioner | 8–10 h best-in-class; 12–24 h midsize; up to 48 h with a 3PL | Practitioner benchmarks; no sampled distribution disclosed | Delivery lands on dock → Pickable or reserve bulk location | ★ attribution |
| 12 | F. Curtis Barry & Company — Undated 17 | Practitioner | 2–6 h best-in-class; targets range from 4–8 h to 24 h; clear dock and staging within 24 h for deeper QA | Practitioner guidance; no sampled distribution disclosed | Received at loading dock → Put into a stock location | ★ attribution |
| 13 | F. Curtis Barry & Company — Undated 18 | Practitioner | 2–8 h best-in-class; 24–72 h or longer for small-to-moderate businesses | Practitioner guidance; no sampled distribution disclosed | Receipt lands on dock → Pickable or bulk reserve location | ★ attribution |
| 14 | Hopstack — Undated 19 | Vendor assertion | 8–10 h for best-performing 3PLs | Sample and collection period not disclosed | Arrival at warehouse dock → Placement in storage location | ★ attribution |
| 15 | FHI — 2026-03-23 20 | Vendor assertion | Best-in-class same-day, often a few hours; average 12–24 h; underperforming 24+ h | Sample and collection period not disclosed | Arrival at dock → Fully received, processed, and stored; process list includes system receipt | ★ attribution |
| 16 | C3 Solutions — 2026-03-30 21 | Vendor assertion | Under 4 h described as a common target in high-performing distribution centers | Target statement; measured basis not disclosed | Arrival at receiving dock → Fully available in inventory system | ★ attribution |
| 17 | PackageX — 2026-02-12 22 | Vendor assertion | Under 4 h described as high-performing; 24–48 h associated with delays | Sample and collection period not disclosed | Products arrive at facility → Scanned, stored, and marked available in WMS | ★ attribution |
| 18 | Deposco — 2023-09-26 23 | Vendor assertion | Best-in-class < 3 hours | No source attached to this cutoff; similarity to WERC does not establish provenance | Not specified for this metric → Not specified for this metric | ★ attribution |
| 19 | s2bi analytics — 2026-03-29 24 | Practitioner advisory | Consistently over 6–8 h in a standard DC described as inefficiency; also repeats external benchmarks | No sampled basis for its own advisory threshold | Trailer arrives at dock door → Confirmed putaway and available in system | ★ attribution |
| 20 | Extensiv — Undated 25 | Attributed restatement | Best-in-class < 3.5 hours, attributed to WERC 2025 | Explicit WERC attribution via Yale; not a separate sample | Physical arrival → Put away and pickable | ★ attribution / ● underlying report |
| 21 | Interlake Mecalux — 2021-01-05 26 | Attributed restatement | Most competent warehouses under 4 h; others up to 48 h, attributed to APQC | Historical APQC attribution; sample not stated | Goods received at docks → Stored on racks | ★ attribution |
| 22 | ShipBob — 2026-08-10 38 | Provider policy | Standard: Arrived within 1 business day of delivery; counted and stowed within 3 business days after Arrived; floor-loaded: up to 2 business days to Arrived, then standard stowing window | Policy windows, not observed averages | Carrier delivery; then Arrived status → Arrived status; then counted and stowed | ★ policy |
| 23 | Red Stag Fulfillment — Undated 40 | Provider service statement | Dock-to-stock in 2 business days; page also says less than two days | Published service statement, not observed performance | Clock trigger not fully specified on inspected page → Stocked inventory | ★ attribution |
| 24 | Red Stag Fulfillment — Undated 41 | Provider best-case statement | Receiving in as little as 1 hour | Best-case wording, not an average or universal maximum | Not specified → Ready for orders | ★ attribution |
Sources: APQC; WERC and the identified Yale/Riekes summaries; ISM; F. Curtis Barry & Company; Hopstack; FHI; C3 Solutions; PackageX; Deposco; s2bi analytics; Extensiv; Interlake Mecalux; ShipBob; Red Stag Fulfillment. Row-level citations identify the material inspected. Original classification: Cincinnati Dock Door Repair Research. Every row verified September 12, 2026. This is a selected evidence register, not a sample of warehouse operations.
Dataset: Benchmark ledger CSV · Benchmark ledger JSON. Both contain source URLs, dates, scope notes, time bases, and verification marks. Neutral citation details identify this page and its edition.
Which figures rest on sampled data
Two benchmark programs underpin the nine direct benchmark or producer/sponsor-summary records in rows 1–9: APQC and WERC. APQC’s current page discloses its peer-group sample; the historical APQC column does not disclose its own sample. WERC’s 2019 handout gives 489 new responses plus pooled 2018 responses, but respondents could skip questions, so that is not a dock-to-stock-specific denominator. The later Yale summaries inspected do not disclose the metric-specific sample sizes. 1 2 4 6 8 9 10 11 12 13
WERC’s best-in-class category denotes the fastest-performing fifth for this lower-is-faster time metric. Its 2026 program page describes quintile-based benchmarks, and the 2019 handout explains the median and performance groups. A median is less sensitive to an extreme observation than a mean; it is not immune to every change in the observations, nor proof that the sample represents all warehouses. 4 5
The remaining numerical records have different roles. Practitioner statements in rows 11–13 and 19 provide experience-based guidance or advisory thresholds without disclosing the sampled distribution behind those statements. Three come from one consultancy, so they are not three independent studies. Their different ranges remain visible rather than being averaged or resolved by choosing whichever number looks most favorable. 16 17 18 24
Vendor assertions in rows 14–18 present targets or performance bands without a disclosed measured basis for those particular claims. The Deposco cutoff happens to match several historical WERC values, but matching numbers alone do not prove attribution. Attributed restatements in rows 20–21 explicitly point to WERC or APQC; they are not new observations, and they prevent treating the other 14 rows as if none had any survey lineage. 19 20 21 22 23 25 26
Provider statements in rows 22–24 describe a policy window, service wording, or a best case. ShipBob’s two-stage receiving policy and Red Stag’s two different descriptions were checked on their own pages. That verifies what they publish, not how frequently they meet it; a service commitment and an as-little-as claim answer different questions. 38 40 41
Why “under 3 hours” and “8–10 hours” are both quoted as best-in-class
The sources do not establish one shared population, method, and clock. WERC’s historical under-3-hour figure is a cutoff for the fastest-performing fifth of its benchmark respondents, not the 80th percentile of durations. Barry’s 8–10-hour figure is practitioner guidance in a 2023 interview, while his consultancy’s own undated pages give other ranges. The register can document that difference; it cannot prove which population or process factor caused it. 4 8 16 17 18
The disagreement should stay visible. A survey label does not turn an interview into a survey, and the absence of a published sample does not make a consultant’s observation fabricated. The publishable fact is what each source says and what it discloses about the claim—not that every source’s “best-in-class” is a validated industry standard.
How has the WERC best-in-class threshold moved, 2019–2026?
The seven inspected report-year summaries show the cutoff moving from under 2 hours in 2019 and 2020 to under 2.144 hours in 2021, under 3 hours in 2022–2024, and under 3.5 hours in 2025. The cutoff’s numerical value therefore increased 75% from 2019 to 2025; this is an original calculation from published summaries, not a longitudinal measurement of the same warehouses. The public 2026 release inspected identifies the metric’s continued popularity but does not disclose its time cutoff. 3 6 8 9 10 11 12 13
Table 2. WERC DC Measures best-in-class dock-to-stock cycle time, by report year
| Report year | Best-in-class (fastest-performing fifth) | Metric-use position | Year-over-year or coverage note | Document read | Mark |
|---|---|---|---|---|---|
| 2016 | Not established by this review | 4th most-used measure | Historical rank supplied in the 2019 handout | WERC 2019 handout 4 | ★ rank |
| 2017–2018 | Not established by this review | Not in top 12 | Absence from this list is not absence of a benchmark | WERC 2019 handout 4 | ★ list history |
| 2019 | Under 2 hours | 9 of top 12 | First top-12 appearance since 2016 | 2019 DC Measures summary 13 4 | ● threshold / ★ 2019 method |
| 2020 | Under 2 hours | 10 of top 12 | No change from the compiled 2019 cutoff | 2020 DC Measures summary 12 | ● |
| 2021 | Under 2.144 hours | 9 of top 12 | Summary describes slightly reduced performance | 2021 DC Measures summary 11 | ● |
| 2022 | Under 3 hours | 6 of top 12 | Summary describes reduced performance | 2022 DC Measures summary 10 | ● |
| 2023 | Under 3 hours | 11 of top 12 | No change | 2023 DC Measures summary 9 | ● |
| 2024 | Under 3 hours | 3 of top 12 | No change | 2024 DC Measures summary 8 | ● |
| 2025 | Under 3.5 hours | 5 of top 12 | Half-hour increase; Yale calls it the largest decline among the top 12 | 2025 DC Measures summary 6 7 | ● |
| 2026 | Not disclosed in inspected public release | Among top five; second item in list, not an explicit rank | 2025–2026 surveys; 36 metrics tracked | WERC release, May 16, 2026 3 | ★ release |
Sources: Yale’s 2020–2025 WERC-report summaries; Riekes Equipment’s reproduction of the 2019 summary; WERC’s 2019 Snapshot handout for historical ranks and methodology; WERC’s May 16, 2026 release. Summary figures and PDF table/graphic values checked directly. Compiled and verified by Cincinnati Dock Door Repair Research, September 12, 2026.
Three things to hold onto when using this table. First, the underlying full reports were not inspected. The thresholds are transcribed from the identified summaries, which is why ● remains on those values. WERC’s program page, checked September 12, 2026, lists the 2026 report at $550 for non-members and $200 for individual members, with complimentary access for the corporate member categories it identifies; those access arrangements are not evidence of the undisclosed threshold. 5
Second, report year is not automatically observation year. The 2019 handout explicitly describes a January survey asking about prior-year performance and pooling 2018 responses. The 2026 release instead describes surveys conducted in 2025 and 2026. Neither document justifies assigning all 2025-report data to calendar 2024 without inspecting that edition’s methodology. Dataset fields therefore retain report years and disclose unknown observation periods. 3 4
Third, a cutoff change is not a fixed-panel result. Best-in-class is the fastest-performing fifth, so a higher duration cutoff is less demanding numerically. But respondent mix, observation periods, and measurement practices can differ across editions. The calculation ((3.5 − 2.0) ÷ 2.0) × 100 = 75% describes the two published cutoff values; it does not prove that any identified respondent, or the industry as a whole, became 75% slower.
The metric-use positions also do not show a continuous climb: #11 in 2023 became #3 in 2024 and #5 in 2025. WERC’s 2026 release lists dock-to-stock among the top five; its second position in that list is not treated here as an independently stated second-place rank. Popularity and speed are different measures, so the rank history does not explain the time cutoff. 3 6 8 9
What does this evidence show, and what does it not show?
It shows that the selected sources attach different evidence types, dates, populations, and clock boundaries to the same metric name. It also shows a reproducible change in the WERC-summary cutoff and a reproducible split in the wording of 20 selected definition passages. It does not supply one pooled distribution from which a national average, a universal target, or a ratio between a typical and top-performing warehouse can be calculated.
APQC’s median and WERC’s fastest-fifth cutoff belong to different studies. Dividing 15.0 by 3.5 would produce arithmetic, but not an observed performance gap between comparable groups; moreover, the WERC value is a strict cutoff, not the average time of its fastest fifth. We do not describe that quotient as an industry ratio. 1 6
The round numbers in the other rows also have different histories. Some are advisory judgments with no disclosed sample, while Extensiv and Interlake Mecalux explicitly attribute their figures to a benchmark producer. A source audit can preserve that provenance without asserting that every 4-hour or 8-hour statement on the internet has been traced to one origin. 17 19 21 25 26
It does not show a national average. APQC’s inspected page does not identify its sample as U.S.-only or disclose its collection period. WERC’s 2026 release explicitly includes respondents outside North America. Neither benchmark is made state- or county-specific by publishing it on this site, and this register has no verified dock-to-stock timing breakdown by industry, Ohio, Hamilton County, or the Cincinnati metro. 1 3
Provider business-day windows remain in their original units. Without the applicable working calendar, cutoff, start event, and exceptions, they cannot be converted into a universal number of elapsed hours. A conversion would still compare a service statement with a measured benchmark unless the evidence types were kept separate. We did not average across sources or create an “industry consensus” from mismatched inputs. 38 40
How was this evidence assembled?
This verification pass checked the draft’s source documents, numeric claims, and data classifications on September 12, 2026. The unit of observation is an evidence record or a selected definition passage—not a warehouse: no facility was surveyed, no real receipts were timed, and no local operation was observed. Original contributions are the source classification, linked comparison tables, defined coding rules, and reproducible arithmetic, not ownership of the underlying benchmark observations.
Collection. We followed the draft’s benchmark references to their issuing organization, original publisher, or explicitly identified reproduction. For WERC, the collection includes six Yale report-year editions from 2020 through 2025, Riekes’s 2019 reproduction, the WERC 2019 handout, and WERC’s 2026 release and program page. The 2025 white paper and companion infographic support one annual evidence record rather than counting as two studies. PDF graphics containing the thresholds were inspected rather than inferring values from filenames or snippets. 3 4 5 6 7 8 9 10 11 12 13
For APQC, we checked the current public measure and the historical column under APQC’s byline. For practitioner and vendor statements, we checked the publisher’s own page to verify the wording and any disclosed basis, not to endorse an unsupported performance band. ShipBob’s current receiving policy and Red Stag’s two pages were successfully inspected. For system semantics, we read Oracle Receiving 26B, Oracle WMS Cloud 25A—including its example chart—and Microsoft’s inventory-status documentation. 1 2 35 36 37 38 40 41
Inclusion rule. Table 1 retains 24 evidence records: 23 contain a numerical time value, including the historical APQC spread, and one records the 2026 WERC release’s non-numerical coverage. The collection is purposeful, not exhaustive and not random. Historical editions, multiple statements from one consultancy, and an explicit restatement remain separate records when their wording or date matters. A record may group companion documents for one edition. It is therefore incorrect to call the 24 rows 24 independent studies, 24 facilities, or a complete census of online benchmarks.
Table 5 retains the draft’s 20-source comparison but rechecks each selected definition passage. A record qualifies when a source gives a start and an endpoint or, for the Oracle report, explicit receiving/putaway eligibility events. We did not broaden the sample after seeing which coding choices would increase a headline percentage, and we do not claim the selection represents all published definitions.
Benchmark coding. The ledger separates a direct survey benchmark, a producer-authored or sponsor survey summary, survey-edition context, practitioner guidance, a vendor assertion, an attributed restatement, a provider policy, a provider service statement, and a provider best case. Rows 1–9 are the nine direct benchmark/producer-summary records. Rows 20–21 also have stated benchmark lineage, but are coded separately as downstream restatements. The 2026 release is context, not a zero-hour result. An absent sample, date, or numeric value remains explicitly absent rather than becoming zero.
Definition coding. The selected passage is the dedicated definition paragraph and its directly attached scope list; the dataset names the heading or passage used. We classify the endpoint as Yes when it explicitly names an inventory-system record, system availability, or a recorded completion event; Implied when it names available or pickable stock without naming a computer event; and No when it names only a physical endpoint. Oracle’s recorded first-putaway requirement qualifies as a system event but not as downstream availability. These are different meanings inside the same broad “Yes” category and remain visible in the stop-event column.
The coding does not claim a whole article omits every system reference merely because its dedicated definition uses a physical endpoint. HashMicro’s later formula uses availability wording; Worldcraft and Dallas discuss system updates later. Their passage-level classifications and those differences are both recorded. FHI’s directly attached definition list includes receipt into the system, so it is not treated as location-only. A reader can reproduce the classification by consulting the named passage rather than searching for the word “WMS” anywhere on the page. 20 32 33 34
Waiting and formulas. Waiting is marked Yes only when the inspected definition, linked scope explanation, or calculation guidance expressly includes waiting in the measured cycle. General discussion of congestion, or the mere presence of elapsed timestamps, does not satisfy that rule. Formula presence is checked separately across the article: an explicit arithmetic expression qualifies; saying “average hours” or “daily average” does not. “Formula present” is not a correctness score—Hopstack’s expression lacks the summation needed for a receipt-average formula. 1 19 24 35
Reproduction. The downloadable CSV and JSON are generated from the same corrected records. The included script checks the 24/23/9 ledger counts; the 20-passage split of 8 Yes, 5 Implied, and 7 No; the 2 explicit-waiting and 8 formula-present counts; and the 75% cutoff calculation. It separately tests the fictional 3-hour and 5-hour receiving example. These checks reproduce the arithmetic and classifications stored in the dataset; they cannot independently validate the benchmark producers’ unpublished raw observations.
Verification marks. ★ verifies the transcription and attribution against the original publisher or issuer. ● identifies an inspected summary whose underlying full report was not inspected. For attributed assertions, the source is primary evidence that the publisher made the statement, not primary evidence that the asserted performance band accurately describes an industry. The distinction applies in the opening statistics, tables, downloads, and source notes.
Dates and refreshes. Publication dates are taken from displayed source text or attributable page metadata; a report year, PDF filename, copyright year, and verification date are not treated as interchangeable. Undated sources remain undated. The dataset version identifies this verification pass, not a common observation year. Provider policies and benchmark snapshots require rechecking before a later edition; a changed page date alone does not refresh the underlying measurements.
What we did not do. We did not inspect the full WERC reports or APQC’s gated percentile values, estimate a 2026 WERC threshold, compute a pooled benchmark, or infer a current Ohio value from a historical table. The readable 2017 APQC column supplies the 44.1-hour spread; we did not independently verify the separate endpoints displayed in its graphic. We make no claim that the assembled comparison is the first such work anywhere online. The originality is the disclosed compilation and coding released here.
How do you calculate dock to stock time?
For one receipt, subtract its declared dock-arrival timestamp from its declared completion timestamp and express the result in hours. For a receipt-level mean, sum the eligible completed receipt durations and divide by their count; calculate the median separately rather than calling that same formula a median. The result changes when the stop event changes, so the recorded-and-put-away endpoint and available-stock endpoint stay separate in this reference’s measurement contract.
One receipt: subtract two declared timestamps
dock_to_stock_hours = (stop_timestamp − carrier_arrival_timestamp) ÷ 3,600 when the difference is measured in seconds. When a spreadsheet or software library already returns hours, do not divide a second time. The start is the actual dock-arrival event in this log; appointment time, gate arrival, unloading start, and receipt creation are different events, not alternative labels for the same timestamp.
Use complete dates and UTC offsets, not time-of-day alone. An overnight receipt and a daylight-saving transition cannot be reconstructed reliably from “08:00” and “11:00” without a date and time basis. The supplied example uses complete offset-bearing timestamps, and the script compares instants after converting them to UTC. The same declared event boundaries apply regardless of how the timestamps are displayed locally.
Many receipts: sum durations, then divide
mean_dock_to_stock_hours = Σ(eligible completed receipt durations) ÷ number of eligible completed receipts.
This is a receipt-level arithmetic mean. SkuNexus and s2bi display a sum-divided-by-receipts formula; APQC describes an average supplier-delivery cycle-time measure but does not display that full arithmetic expression on its public page. Operately’s per-goods example uses a different denominator. A unit-weighted result also needs each unit’s associated duration; simply dividing the sum of shipment durations by the number of items does not make a comparable receipt average. 1 24 29 30
Keep the grain fixed. One truck arrival, one purchase order, one receipt, one receipt line, one pallet, and one item are not automatically equivalent units. This template uses one supplier receipt per row. If several receipt records share an arrival, each counted receipt must have its own eligible goods and completion event; duplicated rows must not create extra observations.
A facility’s median receipt time is the median of its receipt durations. APQC’s displayed median is instead the median of a peer group’s company-level KPI values. Report the facility mean and receipt median as separate results, and match the intended aggregation level before comparing either with a company-level benchmark. A single extreme delay can pull the mean sharply; the median is more resistant, but does not make open receipts or exclusions disappear. 1
Two endpoints, two different answers
The benchmark definitions combine putaway with inventory recording. Availability can be another state: Microsoft documents inventory that is physically present but blocked from downstream use. A release may happen after putaway, before putaway, or during another receiving step; it is not always a final task in one universal sequence. 1 6 37
This page therefore proposes two named endpoints:
Recorded-and-put-away time: the later of confirmed physical putaway completion and receipt posting, minus dock arrival. This operationalizes the two completion requirements named in the benchmark definitions without asserting their exact timestamp implementation is identical.
Available-stock time: the latest of posting, confirmed physical putaway, and explicit release to the declared available state, minus dock arrival. When no hold applies, the availability event still needs to be represented by the system evidence used to confirm that state; a missing timestamp is not automatically permission to reuse another event.
These are this reference’s operational definitions. Neither APQC nor WERC is represented as endorsing this exact log. At receipt grain, each completion timestamp must cover all the eligible quantity in that receipt; a first pallet stored is not the completion of the rest. A partial-release analysis belongs in a separately labeled receipt-line dataset.
Table 3. Worked example: one receipt, two endpoints—illustrative arithmetic, not observed data
| Event | Example timestamp (same day) |
|---|---|
| Carrier arrival at dock | 08:00 |
| Receipt posted in WMS | 09:00 |
| Putaway complete | 11:00 |
| Inventory released to available status | 13:00 |
| Recorded-and-put-away time | 3.0 hours (11:00 − 08:00) |
| Available-stock time | 5.0 hours (13:00 − 08:00) |
Source: fictional timestamps chosen by Cincinnati Dock Door Repair Research to show the arithmetic. No facility was measured. Example and calculation checked September 12, 2026; complete offset-bearing timestamps are in the downloadable worked-example CSV.
Keep unfinished receipts visible
A receipt that has arrived but has not reached the selected completion event has no completed duration yet. Do not record it as zero and do not drop it silently: show completed, open, exception-flagged, missing-data, and excluded records separately, and report the age of the oldest open receipt at a declared cutoff. An exception flag can overlap “open” or “completed”; the reporting categories must say which counts are mutually exclusive and which are not.
A completed-only average can look excellent while a backlog grows on the dock. Define the cohort before measuring: for example, receipts arriving within a stated period, evaluated at a stated cutoff. Include the count still open at that cutoff; a completion-date cohort answers a different question and must be named differently. Do not mix an arrival-based denominator with only whichever completions happened to be easiest to retrieve.
A blank event can mean unfinished work or missing data. The notes and receipt-status records should distinguish those cases. The supplied script reports a missing-completion category and its elapsed age, rather than pretending to infer operational status from a blank. Negative durations and contradictory event dates are rejected for review, not coerced to zero or silently converted into valid records.
Table 4. Receiving log fields: the downloadable template
| Field | What to record | Why it is separate |
|---|---|---|
| receipt_id | One supplier receipt per row; use a separate receipt-line dataset for partial releases | Identifies the denominator; unique and nonblank |
| po_or_asn_number | Purchase-order or advance ship notice reference | Supports documented ASN/no-ASN grouping; reference alone does not establish cause |
| carrier_arrival_timestamp | Actual arrival at the receiving dock; ISO 8601 with UTC offset | Declared dock-start event; gate arrival and appointment time are separate |
| dock_door | Actual door assignment, where recorded | Supports grouping; door number alone does not measure queue depth |
| unload_start_timestamp | Actual beginning of unloading | Separates pre-unload waiting from unloading |
| unload_complete_timestamp | Unloading complete for all eligible goods in this receipt | Ends the unloading interval |
| receipt_posted_timestamp | Receipt confirmed in the WMS/ERP for the eligible goods | System-record event; may precede or follow other work |
| putaway_complete_timestamp | Physical putaway complete for all eligible goods; event provenance recorded | A transaction alone is not proof of physical completion |
| available_in_wms_timestamp | All eligible goods released to the declared available status | Available-stock endpoint; status can be blocked despite physical stock |
| flow_through_flag | Y for receipts containing never-put-away flow-through goods; N otherwise | Separate under this template’s conservative receipt-level exclusion rule |
| exception_flag | Y for an exception such as damage, shortage, inspection hold, or rejection; N otherwise | Report separately; an exception does not automatically erase a receipt |
| dock_to_stock_hours | Recorded-and-put-away hours: later of posting and putaway, minus dock arrival | Derived value; separate available-stock hours are produced by the calculation script |
| notes | Load type, receipt status, eligible quantity, exception details, location, event source, and calendar | Records assumptions and provenance not held in separate columns |
Source: field design by Cincinnati Dock Door Repair Research, with APQC/WERC completion wording and Oracle/Microsoft event semantics as references. This is a proposed measurement specification, not an agency-mandated form. Verified and calculation-tested September 12, 2026. 1 6 35 36 37
Files: Blank receiving log · Data dictionary · Separate legend and fictional example. The blank log contains only the 13 headers so its demonstration rows cannot accidentally enter a real average. The separate companion preserves the field explanations and worked example.
Oracle’s own dock-to-stock report is a useful reference for exclusions, not a universal receiving rule. Oracle WMS Cloud 25A counts fully received shipments whose all LPNs have first-putaway timestamps; later consumption, cancellation, or modification does not remove their original shipment metrics. Crucially, it excludes shipments containing LPNs that will never be put away because of flow-through operations, rather than merely dropping individual LPNs from an otherwise unchanged shipment denominator. Its example chart uses minutes, and its report describes daily averages over the past seven days. 35
This template’s conservative receipt-level flag follows that exclusion principle for never-put-away flow-through goods. An operation choosing a line-level analysis may isolate stored lines instead, but that is a different grain and rule, not the Oracle shipment report reproduced exactly. Document the decision, retain excluded counts, and do not compare partial receipts with fully stocked receipts as though their endpoints were identical.
Why do published dock-to-stock figures disagree?
The inspected definition passages do not all specify the same endpoint, and the numerical sources also differ in population, vintage, and evidence type. In this 20-passage census, eight explicitly name a system or recorded event, five imply a stock-availability state, and seven name a physical endpoint without a computer event in the selected passage. Two sources explicitly include waiting under the coding rule, while eight contain an arithmetic formula somewhere on the inspected page; those counts describe the selected material, not all published definitions.
Table 5. Definition census: 20 published definition passages, coded
| # | Source (type, date) | Clock starts at | Clock stops at | Explicit system event in selected definition? | Waiting explicitly included? | Formula elsewhere on page? |
|---|---|---|---|---|---|---|
| 1 | WERC via Yale summaries (survey summary; 2021–2025 summaries) 6 7 8 9 10 11 | Arrival of goods | Put away and recorded in inventory management system | Yes | Not stated | No |
| 2 | APQC measure 100677 (benchmark database; Undated; checked 2026-09-12) 1 | Supplier delivery received | Put away after inventory recording | Yes | Yes | No |
| 3 | F. Curtis Barry via ISM (consultant interview; 2023-01-30) 16 | Delivery lands on dock | Pickable or reserve bulk location | No | Not stated | No |
| 4 | F. Curtis Barry & Company (consultant; Undated) 18 | Receipt lands on dock | Pickable or bulk reserve location | No | Not stated | No |
| 5 | Hopstack (WMS vendor; Undated) 19 | Arrival at warehouse dock | Appropriate storage location | No | Not stated | Yes |
| 6 | Veryable (labor marketplace; 2024-11-15) 27 | Arrival at warehouse | Availability in inventory | Implied | Not stated | No |
| 7 | Racklify Encyclopedia (directory; Updated 2026-03-19) 28 | Arrival at receiving dock | Inspected, recorded, and available for picking | Yes | Not stated | No |
| 8 | FHI (labor services; 2026-03-23) 20 | Arrival at dock | Fully received, processed and stored; associated list includes system receipt | Yes | Not stated | No |
| 9 | Operately (software; Undated) 29 | Receiving dock | Available inventory | Implied | Not stated | Yes |
| 10 | Oracle WMS Cloud 25A (system report; Version 25A) 35 | Shipment received | All LPNs have recorded first-putaway timestamps | Yes | Not stated | No |
| 11 | Interlake Mecalux (racking supplier; 2021-01-05) 26 | Goods received at loading docks | Stored on racks | No | Not stated | No |
| 12 | s2bi analytics (consultant; 2026-03-29) 24 | Trailer arrives at dock door | Putaway confirmed and inventory available in system | Yes | Yes | Yes |
| 13 | Extensiv (3PL WMS vendor; Undated) 25 | Physical arrival | Put away and pickable | Implied | Not stated | Yes |
| 14 | C3 Solutions (dock scheduling vendor; 2026-03-30) 21 | Shipment arrives at receiving dock | Fully available in warehouse system | Yes | Not stated | No |
| 15 | SkuNexus (software; 2018-10-02) 30 | Receipt of goods | Items placed in storage | No | Not stated | Yes |
| 16 | Propel Apps (software; 2024-03-06) 31 | Arrival at warehouse dock | Stocked and ready for picking | Implied | Not stated | Yes |
| 17 | HashMicro (ERP vendor; Published 2026-01-23; updated 2026-07-08) 32 | Arrival at receiving dock | Final putaway location | No | Not stated | Yes |
| 18 | Worldcraft Logistics (3PL; 2023-12-12) 33 | Goods received at loading docks | Stored on racks | No | Not stated | No |
| 19 | Dallas Warehouse Space (directory; 2024-12-10) 34 | Shipment at receiving dock | Available inventory | Implied | Not stated | No |
| 20 | PackageX (receiving software; 2026-02-12) 22 | Products arrive at facility | Scanned, stored, and marked available in WMS | Yes | Not stated | Yes |
Sources: the publisher pages and software documentation identified in each row, inspected September 12, 2026. Selected-passage locators and coding notes are in the CSV and JSON. Original coding: Cincinnati Dock Door Repair Research. Counts: explicit system event 8; availability implied 5; physical endpoint only in selected passage 7; waiting explicitly included 2; arithmetic formula present 8.
Dataset: Definition census CSV · Definition census JSON.
“Physical endpoint only” does not mean the source recommends leaving inventory unrecorded. HashMicro’s dedicated definition uses final putaway while its formula uses sale availability; Worldcraft later discusses recording, and Dallas later describes WMS availability. The register preserves those internal wording differences. Likewise, Oracle’s recorded first-putaway requirement establishes a system event but not sale availability, so grouping both under “Yes” must not erase the actual stop-event text. 32 33 34 35
Formula presence is also not a quality score. Hopstack presents a timestamp difference divided by shipment count without showing a sum across shipments; APQC names an average measure but does not display a corresponding arithmetic formula. The published page here uses the explicit receipt-level summation above, distinguishes it from a median, and does not import an incorrect expression merely because a source has a formula heading. 1 19
Three ways the clock gets started late or stopped early
Starting at unload instead of the declared arrival. In a fictional example, a trailer waiting ninety minutes after dock arrival has already accumulated ninety minutes on a dock-arrival clock. A first-scan start would hide that interval. Waiting before the declared dock arrival is a separate gate/yard interval unless the operation names a broader start; APQC’s inclusion of waiting does not authorize silently switching between those starts. 1 25
Stopping on the rack instead of checking both completion events. Seven selected passages name a physical endpoint without explicitly adding a computer event. In an operation where physical storage precedes receipt posting, ending at storage would omit the posting lag; in an operation that posts first, the remaining physical putaway still matters. This is why the proposed calculation uses the later of the two, rather than assuming one event always precedes the other. 1 6 36
Counting business days as elapsed hours. ShipBob’s standard policy gives up to one business day to mark inventory Arrived and a separate three-business-day stowing window after that status; floor-loaded and unmatched receiving orders have different triggers. Red Stag’s two-business-day service wording uses another basis again. There is no universal 48-to-96-hour conversion or fixed multiplier: the working calendar, cutoff, holidays, actual starting instant, and policy exceptions must be known. Even after a valid conversion, a service promise is not a measured average. 38 40
Table 6. Provider and system clocks compared
| Source | What the clock measures | Start event | Stop event | Basis |
|---|---|---|---|---|
| WERC via Yale 6 | Dock-to-stock cycle time | Arrival of goods | Put away and recorded in inventory system | Hours; report year does not establish one universal observation year |
| APQC measure 100677 1 | Supplier-delivery cycle time | Delivery received from supplier | Put away after inventory recording; waiting included | Hours; peer-group median, 3,560 companies; collection period undisclosed |
| Oracle WMS Cloud 25A 35 | Dock to stock per day | Shipment received | All LPNs have first-putaway timestamps | Past-seven-day daily averages; example chart uses minutes; specified flow-through shipments excluded |
| Oracle Receiving 26B 36 | Not a timing benchmark: transaction routing | Receipt transaction | Direct: automatic system putaway in same transaction; standard: separate putaway; inspection: inspection before putaway | Transaction events, not proof of physical movement duration |
| Microsoft Dynamics 365 37 | Not a timing benchmark: inventory availability | Status assignment/change, not one prescribed timing start | Blocked stock remains physical stock but is unavailable for downstream transactions | Status is not interchangeable with physical putaway |
| ShipBob policy 38 | Separate receiving service windows | Carrier delivery; then Arrived status | Standard Arrived within 1 business day; counted and stowed within 3 business days after Arrived | Business days; floor-loaded and unmatched-order exceptions retained in Table 1 and policy |
| Red Stag Fulfillment 40 41 | Service statement and best case | Not fully specified on inspected pages | Two-business-day dock-to-stock statement; as-little-as-one-hour receiving statement | Business days for service statement; hours for best case; neither is an observed average |
Sources: Yale’s WERC summary; APQC measure 100677; Oracle WMS Cloud 25A; Oracle Receiving 26B; Microsoft Learn inventory statuses, updated July 1, 2026; ShipBob policy, August 10, 2026; the two undated Red Stag pages. Original crosswalk: Cincinnati Dock Door Repair Research. Verified September 12, 2026.
What is the dock to stock process, and where does it lose time?
The receiving process can include arrival, unloading, staging, verification, receipt posting, putaway, inspection, and availability release, but not every operation performs those events in one fixed order. Oracle Receiving 26B distinguishes direct, standard, and inspection routes, including a standard route where goods can wait at the dock before putaway. The log can locate elapsed intervals; it cannot, on its own, establish which equipment, staffing, supplier, or scheduling issue caused them. 20 36 37
Table 7. Delay-evidence map: what each interval can and cannot prove
| Interval (from Table 4 fields) | What is being tracked | What the interval can show | What it cannot prove on its own |
|---|---|---|---|
| Carrier arrival → unload start | Pre-unload coordination and readiness for safe handling | Elapsed pre-unload waiting at the declared dock start | Cause of the wait; door availability and appointment adherence require separate records |
| Unload start → unload complete | Unloading of the receipt’s goods | Elapsed unloading window | A rate without quantities, or a staffing/load-type effect without comparable records |
| Unload complete → receipt posted | Completion of physical unloading relative to system posting | Post-unload posting lag when posting happens later | Total verification labor or an ASN effect; posting may happen before unloading ends |
| Receipt posted → putaway complete | Timing relationship between system posting and physical putaway | Remaining time after posting when putaway finishes later | Queue depth, travel distance, or slotting causality; events can occur in the opposite order |
| Putaway complete → available status | Timing relationship between storage and availability | Post-putaway availability lag when availability occurs later | Whether a hold was justified; inspection and holds may precede putaway |
| Equipment event overlapping any interval | Recorded truck, leveler, or door unavailability and restoration | Which receipts overlapped the documented event | Causal delay or a cost figure; overlapping intervals cannot be summed as if sequential |
Source: original interval-analysis framework by Cincinnati Dock Door Repair Research, September 12, 2026, using Table 4’s fields. Oracle Receiving 26B supports the route distinctions; Microsoft Learn supports the separation of physical inventory and availability. No interval is presented as a measured delay, causal estimate, or cost finding. 36 37
The first pass is a timestamp audit, not a blame assignment. A long arrival-to-unload interval establishes waiting after the declared start; staffing rosters, appointments, equipment-event records, and load characteristics are additional evidence needed to evaluate explanations. An unloading rate requires both elapsed time and a quantity; a timestamp pair alone supplies only duration. A comparison of ASN and non-ASN receipts likewise does not isolate the ASN’s effect unless other relevant differences are addressed.
Posting, inspection, and physical putaway may overlap or occur in a different order. Where Table 7 names an interval whose second event occurred first, treat it as an event-order finding, not a negative “delay.” Do not sum overlapping processing windows as though they formed one uninterrupted sequence, and do not subtract a hold from elapsed time unless a separately named active-time measure is being reported beside the full elapsed measure.
Inspection routes
A dock-to-stock inspection step is an explicitly documented route in Oracle Receiving 26B, not proof that every delivery requires the same inspection. Oracle describes receipt, inspection, and putaway as separate steps in that route; accepted and rejected material can be directed to different locations. An operation with required checks should retain those checks in the measurement boundary when they occur inside the clock, and compare like-for-like requirements rather than deleting inspection time to improve the result. 36
A quality hold is not automatically a post-putaway interval. The Microsoft status documentation permits availability restrictions at different stages, so the log must use actual event order and the chosen completion endpoint. This reference makes no blanket claim that every food, pharmaceutical, or regulated-component receipt has the same mandatory hold, or that the existence of an inspection necessarily explains a particular delay. 37
Equipment downtime in the log
Equipment events belong in the evidence trail: record which truck, door, or leveler was unavailable, the event’s start and end, and the receipts that overlapped it. That shows exposure to an event, not the counterfactual time each receipt would have taken without it. A dollar loss additionally requires a defensible cost model and attributable delay; this reference supplies neither an hourly loss rate nor a percentage improvement from repair.
Speed does not override safe operation. OSHA’s powered-industrial-truck rule requires unsafe trucks to be removed from service until safe operating condition is restored, and its maintenance provisions assign repairs to authorized personnel. Those citations concern powered industrial trucks; they are not represented here as the same legal rule for every dock door or leveler. Hazardous equipment work remains a matter for personnel qualified and authorized for that work, not an operational shortcut in this timing guide. 42 43
Can these benchmarks be applied to Ohio and Hamilton County?
The measurement framework transfers; a local performance number does not. This review did not verify a dock-to-stock average for Ohio, Hamilton County, or the Cincinnati metro, so it publishes none. The sourced local context is workforce and geography: BLS estimates 7,650 shipping, receiving, and inventory clerks in the Cincinnati metro in May 2025, with location quotient 1.32—not a count of receipts or a measure of their speed. 44
Table 8. Geographic evidence coverage
| Geography | Dock-to-stock evidence | Receiving-work context | Vintage | Mark |
|---|---|---|---|---|
| Cross-industry reference populations; not a U.S.-only estimate | APQC median 15.0 h, n = 3,560; WERC fastest-fifth cutoff <3.5 h in 2025 summary | Different populations and statistics; not a national average 1 6 | APQC collection period undisclosed; WERC report year 2025 | ★ / ● |
| Ohio | No state timing estimate verified in this review | Historical BLS estimate: 40,640 shipping, receiving, and inventory clerks; fourth-highest state count in the cited table; location quotient 1.32 45 | May 2022, not May 2025 or 2026 | ★ historical estimate |
| Cincinnati, OH-KY-IN metro, including Hamilton County | No metro timing estimate verified in this review | BLS estimates: 7,650 shipping, receiving, and inventory clerks (LQ 1.32; mean $22.15/h, $46,080/year); 1,530 cargo and freight agents (LQ 2.22); transportation/material moving 9.8% of jobs vs 8.8% nationally, mean $26.60/h vs $23.96 44 | May 2025; release July 20, 2026 | ★ estimates |
| Hamilton County, Ohio | No county timing estimate verified in this review | Included in metro geography; the cited release does not split its occupation estimates into county totals 44 | BLS May 2025 metro geography | ★ scope only |
| CVG; Cincinnati/Northern Kentucky airport | No airport dock-to-stock estimate supplied | Airport states 6th-largest cargo airport in North America and 12th globally in 2023; Amazon primary U.S. Air Hub and DHL Global Super Hub for the Americas 47 | 2023 ranking; hub descriptions checked September 12, 2026 | ★ airport statement |
Sources: BLS, “Occupational Employment and Wages in Cincinnati — May 2025,” released July 20, 2026; BLS permanent May 2022 occupation profile 43-5071; CVG Airport, Air Cargo. Benchmark scope from APQC and the identified WERC summary. Original geographic crosswalk: Cincinnati Dock Door Repair Research. Verified September 12, 2026.
The BLS metro definition includes Brown, Butler, Clermont, Hamilton, and Warren counties in Ohio; Dearborn, Franklin, and Ohio counties in Indiana; and Boone, Bracken, Campbell, Gallatin, Grant, Kenton, and Pendleton counties in Kentucky. The metro estimate is not a Hamilton County estimate. Location quotient compares the occupation’s share of employment locally with its share nationally; 1.32 does not mean that Cincinnati has 1.32 times the country’s total number of clerks. 44
The Ohio row deliberately retains its May 2022 vintage. Its 40,640 estimate and position in BLS’s highest-employment state table were verified against the permanent historical profile. The May 2025 Ohio query returned a database-unavailable notice during this pass; the old count was not moved into the newer year or inferred from the metro total. These observations cannot form an Ohio workforce trend because they describe different years and geographies. 45 46
An operation using these references should first define a consistent local cohort and clock—for example, a full quarter of arrivals, with open receipts evaluated at a named cutoff. Report its mean, receipt median, open count, and the two completion endpoints separately. Compare only the suitably aggregated KPI with the benchmark’s definition and population in view; a facility’s receipt median is not automatically comparable with APQC’s company-level median. A single facility’s measurement is not an Ohio or Hamilton County benchmark. 1
The geography fields in the supporting context file identify scope rather than manufacture local timing. Future local observations would need their own consent, sampling method, receipt definitions, date range, denominators, and disclosure of participating operations’ selection. None is implied by the current workforce table or by the fact that this reference is published in Cincinnati.
Why does dock-to-stock time matter more now?
Recent WERC material keeps dock-to-stock among frequently tracked operating measures, while Yale’s 2025 summary reports a higher best-in-class time cutoff than its 2024 summary. That combination makes measurement boundaries worth checking; it does not prove every warehouse is tracking the metric more closely or becoming slower. The directly supported finding is continued reported relevance alongside a change in the published cutoff. 3 6 8
Dock-to-stock ranked #11 in Yale’s 2023 summary, #3 in 2024, and #5 in 2025; WERC’s 2026 release includes it among the five most popular metrics. Over the 2023–2025 summaries the time cutoff changes from under 3 hours to under 3.5. Yale describes the half-hour increase as the largest decline among the top 12 and discusses SKU growth, deliveries, and labor pressures as context; this reference attributes that explanation to Yale rather than presenting those factors as causally measured effects. 3 6 8 9
The respondent geography also changes. WERC’s 2019 handout reports 12.7% of respondents outside North America, compared with 17.2% in the 2026 release. Those are survey-wide respondent shares, not the regional composition of the dock-to-stock item’s completed answers, and changing pools weaken any fixed-panel interpretation. They also show why a U.S.-facing reference must not relabel the source as U.S.-only. 3 4
The practical distinction remains the clock. A benchmark involving physical putaway and an inventory record does not answer when blocked stock becomes usable; a provider promise starting at an Arrived status does not necessarily begin at the carrier’s delivery instant. The source register makes those boundaries explicit instead of turning differences in wording into an unsupported industry speed gap. 1 37 38
Other operating measures—such as on-time shipments and warehouse capacity—provide context but are outside this page’s scope. WERC’s release lists them alongside dock-to-stock; this reference does not combine their statistics with receiving times or imply that one predicts another. It remains a dock-to-stock measurement and evidence reference. 3
What are this reference’s limitations?
This is a verified compilation of published statements and an original coding framework, not a new operational survey. Its original counts describe the selected documents and definition passages, while its benchmark numbers retain the producers’ own limitations. Unknown values, changing populations, and different clock boundaries prevent a defensible pooled average or universal ranking.
No new warehouse survey. No receipts were observed, facilities timed, or operators surveyed. The sample units in the original evidence asset are records and passages; the receiving timestamps are fictional demonstrations.
WERC thresholds come from identified summaries. The full annual reports were not inspected. Public summary transcription is verified, but the underlying values, metric-specific denominators, and full methodologies are not independently audited here; ● remains on those records.
No 2026 WERC hour value was verified. The inspected release establishes inclusion among the top five and the report’s coverage, not a numerical time threshold or explicit second-place rank. A source being access-controlled does not prove the value appears nowhere else; this review simply did not verify it. 3 5
APQC’s observation vintage is not displayed. The 15.0-hour median and 3,560-company sample are the public snapshot checked September 12, 2026. The 25th and 75th values are not displayed in that public view. The 2017 column is a separate historical source; only its readable 44.1-hour spread is reproduced. 1 2
Selected sources are not representative. The 24 ledger records and 20 definition passages are a purposeful collection. The register does not establish what fraction of all online sources is correct, what fraction of warehouses uses a given definition, or that this is the first such compilation.
Definition coding has a declared unit. Later text may add system or availability requirements absent from a dedicated definition. The dataset records those differences and its passage locators; a “No” does not mean the entire publisher recommends ignoring inventory records. Formula presence also does not certify correct arithmetic.
Provider policies are wording, not outcomes. ShipBob’s policy and Red Stag’s statements were read, but no receipts were analyzed to measure compliance with them. A service window, an observed average, and a best-case statement remain distinct. 38 40 41
Practitioner ranges share lineage. Three practitioner records come from F. Curtis Barry & Company. Their different wording is preserved; it is not three independent samples and is not resolved by averaging. 16 17 18
Business-day clocks were not normalized. No universal conversion to elapsed hours is imposed. A conversion needs the applicable calendar, cutoffs, exceptions, and start instant; it would not by itself make a provider promise comparable to a survey result.
Software documentation is not physical-time data. Oracle’s routing and report rules and Microsoft’s inventory statuses establish transaction and state semantics, not the physical duration of an actual receipt. Oracle’s chart is an example, not a warehouse benchmark imported into this reference. 35 36 37
No local timing estimate was verified. The Ohio and Cincinnati figures describe estimated employment and geography. Ohio’s state count remains explicitly historical, and the metro values cannot be reassigned to Hamilton County. CVG’s ranking remains explicitly 2023. 44 45 47
The worked example is fictional. Table 3 and its CSV illustrate arithmetic. Three hours and five hours are results from selected demonstration timestamps, not observations or proposed operating targets.
Figures we could not verify
The current 2026 WERC time cutoff; its metric-specific sample size; APQC’s undisplayed public percentile values and current collection period; the separate endpoints in the 2017 APQC graphic; the May 2025 Ohio statewide occupation estimate; and a dock-to-stock average for Ohio, Hamilton County, or the Cincinnati metro were not verified in this pass. They are not assigned invented values. ShipBob’s current arrival and stowing windows, by contrast, were verified against its August 10, 2026 policy and are included with their actual triggers. 1 2 3 38 46
How is this page identified in a citation?
This page is identified by its organizational publication, full title, canonical URL, and verification date below. The dataset version names the corresponding evidence snapshot; source benchmarks retain the attribution to their original producers given in the ledger.
Publication: Cincinnati Dock Door Repair Research
Page title: Dock to Stock Time: Definition, Formula, and Benchmarks (2019–2026 Data)
URL: https://cincinnatidockdoorrepair.com/research/dock-to-stock-time/
Last verified / updated: September 12, 2026
Dataset version: 2026-09-12
Cincinnati Dock Door Repair Research is the independent research and reference section of cincinnatidockdoorrepair.com.
What does the dataset download contain?
The dataset contains the corrected source ledger, definition census, measurement template, system/qualification notes, and geographic context behind the tables. CSV and JSON versions contain the same records, and the included Python script reproduces the original counts and fictional calculation checks. None of the files contains a hidden warehouse sample or an estimate of an undisclosed benchmark.
Complete dataset: Dock-to-stock dataset, version 2026-09-12, ZIP.
Benchmark ledger: CSV · JSON. There are 24 evidence records, including 23 numerical records and the 2026 WERC release without an hour value. Fields identify publisher, evidence class, document date, report year where applicable, published value, sample basis, start and stop, time basis, source URLs, verification tier, and limitations. Annual companion documents can be grouped in one record; the record count is not an independent-study count.
Definition census: CSV · JSON. There are 20 selected definition records, with start/stop wording, system-event classification, explicit-waiting classification, formula presence, passage locator, coding notes, source URL, and verification date. The locators and notes make the published 8/5/7 classification and formula/waiting counts inspectable.
Receiving log: Blank 13-field CSV · Field dictionary · Legend and fictional example. The blank template has no data rows. The separate worked-example CSV contains only the fictional receipt used for the 3-hour and 5-hour demonstration; it is not a sample warehouse record.
Ohio and Cincinnati context: CSV · JSON. Seven records preserve the geographic facts grouped into Table 8’s five rows, with individual vintages and sources. The historical Ohio estimate is labeled May 2022, the metro estimates May 2025, and the airport ranking 2023.
System and safety semantics: CSV · JSON. Four source records capture Oracle’s report exclusions and receipt routes, Microsoft’s status distinction, and the OSHA powered-industrial-truck provisions. These are documentation and regulatory references, not measured operating times.
Verification and reproduction: Source manifest · Calculation script · Dataset README. The source manifest identifies the documents and their verification dates; the script checks the stored classifications and arithmetic without making live web requests or claiming to reproduce the producers’ underlying surveys.
The files are versioned September 12, 2026. Evidence rows carry their source URLs and verification dates; the blank template and original design files instead identify their field definitions or version. The downloads do not reproduce full third-party reports, and this page does not grant a license over another publisher’s underlying data.
What else do readers ask about dock to stock time?
The questions below summarize the same measurement boundaries, benchmark distinctions, and exclusions used in the tables. They introduce no additional performance targets or local estimates. Where a system or provider uses a different clock, its own named rule remains separate from this reference’s proposed log.
What is dock to stock time?
Dock-to-stock time measures elapsed time from a declared inbound-arrival event to a declared stocked-inventory state. APQC’s supplier-delivery definition and the WERC definitions reproduced by Yale include inventory recording and putaway; APQC expressly includes waiting. This reference separately measures availability release rather than assuming every use of “stock” includes that event. 1 6 37
What is a good dock to stock time?
APQC’s inspected public page displays a 15.0-hour company-level median, with a 3,560-company sample and undisclosed collection period. Yale’s 2025 WERC summary reports an under-3.5-hour cutoff for the fastest-performing fifth. These are not directly comparable parts of one distribution; an operating target needs matched scope, receipt characteristics, and clock definitions. 1 6
How do you calculate dock to stock time?
For this reference’s recorded-and-put-away endpoint, subtract dock arrival from the later of physical putaway completion and receipt posting, then express the duration in hours. Sum eligible completed receipt durations and divide by their count for the mean. Calculate the receipt median separately, preserve open and excluded counts, and name a different endpoint when including availability release.
Is dock to stock time measured in hours or days?
APQC and the inspected WERC summaries express it in hours; Oracle’s 25A report example chart uses minutes. ShipBob and Red Stag publish business-day service windows. Units can be converted only with the appropriate time basis, and converting a provider promise does not turn it into a measured benchmark. 1 6 35 38 40
Does dock-to-stock include unloading, inspection, and putaway?
An elapsed clock includes the work and waiting that occur between its declared start and stop. In Oracle’s inspection route, inspection precedes putaway; in other workflows, a hold or availability release may occur elsewhere. A required step inside the clock is included, but the reference does not assume every receipt needs inspection or that every inspection causes a later completion. 1 36 37
Does the clock include weekends, waiting, and quality holds?
This reference’s elapsed-time calculation includes weekends and waiting between the selected timestamps. APQC expressly includes waiting; provider business-day policies use a different basis. Holds can occur before or after putaway, so the recorded-and-put-away and available-stock endpoints may include different portions of a hold; the timestamps and chosen endpoint determine the result. 1 37 38
Is dock-to-stock the same as receiving lead time or putaway cycle time?
Not automatically. A putaway-only measure can cover the move into storage without the earlier receiving interval; “receiving lead time” needs an explicit start and stop before comparison. The inspected Oracle routing and reporting documents distinguish receipt and putaway events, so a system label alone is not enough to establish the same clock. 35 36
Can inventory be put away but still unavailable to ship?
Yes. Microsoft’s Dynamics 365 documentation describes blocked inventory that is counted as physical inventory but cannot be used for sales, transfers, production, or other outbound transactions. Physical storage and a receipt record therefore do not, by themselves, prove the stock is released for use; the available-stock endpoint captures the additional state. 37
How should cross-docked goods and partial receipts be handled?
Oracle’s 25A report excludes shipments containing LPNs that will never be put away because of flow-through operations. This reference’s receipt-level template flags such receipts separately; an alternative line-level analysis needs its own rules. Partial releases must not be mixed into a completed-receipt average as though the entire eligible quantity had reached the endpoint. 35
What are the steps in the dock to stock process?
Common receiving activities include arrival, unloading, staging, verification, posting, putaway, and any applicable inspection or availability release. Their order depends on the workflow: Oracle documents direct receipt and automatic system putaway in one transaction, standard receiving with separate putaway, and inspection routing with inspection before putaway. Those are process descriptions, not hazardous-work instructions or measured durations. 20 36
Is there a verified Ohio or Hamilton County dock-to-stock average?
This review did not verify one and does not estimate one. BLS’s 7,650 shipping, receiving, and inventory clerks is a May 2025 employment estimate for the whole Cincinnati metro, not a county count or receiving-speed statistic. The Ohio state figure retained here is explicitly historical, from May 2022. 44 45
Where does the WERC number come from, and why does it change?
The thresholds in this reference come from identified summaries of WERC’s annual DC Measures reports. Best-in-class denotes the fastest-performing fifth; changes in the published cutoff can reflect different samples, periods, and practices, not necessarily the same warehouses getting slower. The 2019 handout and 2026 release disclose different survey-period information, so the report year alone does not establish one observation year. 3 4 6
Which sources support this reference?
The sources below identify the original publishers, issuing organizations, software documentation, and disclosed benchmark reproductions used in the tables. Each entry separates its publication or report vintage from this pass’s September 12, 2026 verification date; access-controlled underlying reports are not represented as inspected. Source identifiers are retained across the page and files, including gaps left by unused or superseded draft references.
[1] APQC, “Dock-to-stock cycle time in hours for supplier deliveries,” measure 100677. Undated public benchmark snapshot; collection period not displayed. Verified September 12, 2026.
https://www.apqc.org/resources/benchmarking/open-standards-benchmarking/measures/dock-stock-cycle-time-hours-supplier
[2] APQC, “Metric of the Month: Dock-to-Stock Cycle Time in Hours for Supplier Deliveries,” published under APQC’s byline in Supply & Demand Chain Executive, March 2, 2017. Historical producer-authored summary. Verified September 12, 2026.
https://www.sdcexec.com/warehousing/news/12311448/apqc-metric-of-the-month-dock-to-stock-cycle-time-in-hours-for-supplier-deliveries
[3] WERC, “WERC’s 2026 DC Measures Report Delivers Benchmarks for an Industry at an Inflection Point,” May 16, 2026. Surveys conducted in 2025–2026; the release does not disclose the numerical dock-to-stock threshold. Verified September 12, 2026.
https://werc.org/news/727406/
[4] WERC, “DC Measures 2019 Snapshot in Time.” 2019 presentation handout; survey timing, overall response count, pooled responses, and metric-use history. The overall response count is not the dock-to-stock item count. Verified September 12, 2026.
https://cdn2.hubspot.net/hubfs/476052/2019_WERC_DC_Measures%202019_Handout.pdf
[5] WERC, “DC Measures.” Program page, including report access, pricing, and quintile-based presentation; current page inspected September 12, 2026. Verified September 12, 2026.
https://werc.org/page/ASSESS-DC_Measures
[6] Yale Materials Handling, “Benchmarking and improving distribution center metrics.” Summary of the 2025 WERC report, copyright 2025; dock-to-stock on PDF page 3. A production code is not treated as a verified publication day. Verified September 12, 2026.
https://www.yale.com/globalassets/coms/yale/north-america/documents/white-papers/0000ybc0wp001_e_en-us_benchmarking-and-improving-dc-metrics.pdf
[7] Yale Materials Handling, “Top 12 distribution center metrics.” Infographic summarizing the 2025 WERC report, dock-to-stock item 5. Companion to source 6, not a separate survey. Verified September 12, 2026.
https://www.yale.com/globalassets/coms/yale/north-america/documents/white-papers/snack-drawer/YALE-1520_WERC-DC-Metrics-infographic.pdf
[8] Yale Materials Handling, “Benchmarking and improving distribution center metrics.” Summary of the 2024 WERC report, copyright 2024; dock-to-stock on PDF page 3. Hosted PDF filename is not used as a publication date. Verified September 12, 2026.
https://scg-lm.s3.amazonaws.com/pdfs/Yale-wp-dcmetrics-111324.pdf
[9] Yale Materials Handling, “Benchmarking and improving distribution center metrics.” Summary of the 2023 WERC report; dock-to-stock on PDF page 3. Report year retained without inferring an exact publication day from the filename. Verified September 12, 2026.
https://s3.amazonaws.com/scg-mmh/pdfs/yale-wp-benchmarking_and_improving_distribution_center_metrics-110823.pdf
[10] Yale Materials Handling, “Improving DC metrics.” Summary of the 2022 WERC report; dock-to-stock on PDF page 3. Exact publication day not established. Verified September 12, 2026.
https://s3.amazonaws.com/scg-mmh/pdfs/yale-wp-Improving_dc_%20metrics-071922.pdf
[11] Yale Materials Handling, “Improving DC metrics.” Summary of the 2021 WERC report; dock-to-stock on PDF page 3. Exact publication day not established. Verified September 12, 2026.
https://s3.amazonaws.com/scg-mmh/pdfs/yale-wp-dc_metrics-111521.pdf
[12] Yale Materials Handling, “Top 12 distribution center metrics.” Infographic summarizing the 2020 WERC report, copyright 2021; dock-to-stock item 10. Report year and document copyright year are distinct. Verified September 12, 2026.
https://s3.amazonaws.com/scg-lm/pdfs/yale_wp_Top_12_distribution_center_metrics_021021.pdf
[13] Riekes Equipment, “How to Improve Distribution Center Metrics.” Undated reproduction identifying the 2019 WERC report and Yale’s summary; dock-to-stock item 9. Used as a disclosed reproduction, not as the underlying survey. Verified September 12, 2026.
https://riekesequipment.com/resource-library/white-paper-improving-dc-metrics/
[16] Institute for Supply Management, “The Monthly Metric: Dock-to-Stock Cycle Time,” Inside Supply Management, January 30, 2023. Original interview with Brian Barry of F. Curtis Barry & Company; practitioner guidance, not an ISM survey. Verified September 12, 2026.
https://www.ismworld.org/supply-management-news-and-reports/news-publications/inside-supply-management-magazine/blog/2023/2022-01/the-monthly-metric-dock-to-stock-cycle-time/
[17] F. Curtis Barry & Company, “10 Efficiency Ideas for Improving Dock to Stock Times.” Publication date not displayed in the inspected article; practitioner guidance. Verified September 12, 2026.
https://www.fcbco.com/blog/dock-to-stock-efficiency-ideas
[18] F. Curtis Barry & Company, “How To Assess Your Ecommerce Warehouse Dock-to-Stock Efficiency.” Publication date not displayed in the inspected article; practitioner guidance. Verified September 12, 2026.
https://www.fcbco.com/blog/how-to-assess-your-ecommerce-warehouse-dock-to-stock-efficiency
[19] Hopstack, “Dock-to-Stock Time,” glossary. Undated. The page contains a formula; its displayed shipment-average expression does not show a summation. Verified September 12, 2026.
https://www.hopstack.io/glossary/dock-to-stock-time
[20] FHI, “What Is Dock-to-Stock Time? (And How to Reduce It in Your Warehouse),” March 23, 2026. Publisher’s process definition and benchmark assertions; sampled basis not disclosed for the asserted performance bands. Verified September 12, 2026.
https://www.fhiworks.com/what-is-dock-to-stock-time-and-how-to-reduce-it-in-your-warehouse/
[21] C3 Solutions, “What does dock-to-stock mean and why does it matter?,” March 30, 2026. Definition and publisher’s target statement. Verified September 12, 2026.
https://www.c3solutions.com/blog-c3/dock-to-stock/
[22] PackageX, “What Is Dock to Stock in Ecommerce?,” February 12, 2026. Definition, formula, and publisher’s performance assertions. Verified September 12, 2026.
https://packagex.io/blog/what-is-dock-to-stock-in-ecommerce
[23] Deposco, “Top warehouse management metrics to track in 2024,” September 26, 2023 as displayed on the inspected page. The dock-to-stock cutoff is not directly attributed to a particular WERC edition. Verified September 12, 2026.
https://deposco.com/blog/top-warehouse-management-metrics-to-track-in-2024/
[24] s2bi analytics, “Warehouse Receiving Process: Dock-to-Stock Explained,” March 29, 2026. Definition, formula, and advisory threshold; third-party benchmarks retain their original attribution. Verified September 12, 2026.
https://s2bianalytics.com/warehouse-receiving-process/
[25] Extensiv, “3PL Fulfillment KPIs: Formulas & Benchmarks.” Publication date not established from the inspected article; dock-to-stock formula and explicit WERC 2025 attribution. Verified September 12, 2026.
https://www.extensiv.com/blog/3pl-fulfillment-kpis-formulas-benchmarks
[26] Interlake Mecalux, “Dock to stock: efficiency starts at the loading dock,” January 5, 2021. Historical restatement attributed to APQC, not a new sample. Verified September 12, 2026.
https://www.interlakemecalux.com/blog/dock-to-stock
[27] Veryable, “The First Step to Faster Fulfillment: Mastering Dock-to-Stock Cycle Times,” November 15, 2024. Definition passage used in Table 5. Verified September 12, 2026.
https://www.veryableops.com/blog/the-first-step-to-faster-fulfillment-mastering-dock-to-stock-cycle-times
[28] Racklify Encyclopedia, “Speeding Up: How to Slash Your Dock-to-Stock Time by 50%,” updated March 19, 2026. Definition passage only; this reference does not adopt the headline’s improvement claim. Verified September 12, 2026.
https://racklify.com/encyclopedia/speeding-up-how-to-slash-your-dock-to-stock-time-by-50/
[29] Operately, “Average Dock-to-Stock Time — Inventory Management KPI Examples.” Undated. Definition and per-goods formula; not a receipt-level sampled benchmark. Verified September 12, 2026.
https://kpiexamples.operately.com/inventory-management/average-dock-to-stock-time/
[30] SkuNexus, “18 Warehouse Management KPIs You Need to Track,” October 2, 2018. Dock-to-stock definition and total-hours-per-supplier-receipt formula. Verified September 12, 2026.
https://www.skunexus.com/blog/warehouse-management-kpis
[31] Propel Apps, “Optimizing Dock-to-Stock Cycle Time,” March 6, 2024. Definition and elapsed-time formula. Verified September 12, 2026.
https://www.propelapps.com/blog/optimizing-dock-to-stock-cycle-time-a-metric-for-warehouse-operations
[32] HashMicro, “Understanding Dock-to-Stock: How to Improve Receiving and Putaway Faster,” published January 23, 2026; updated July 8, 2026. Dedicated definition and later formula use different completion wording. Verified September 12, 2026.
https://www.hashmicro.com/my/blog/dock-to-stock-improvement/
[33] Worldcraft Logistics, “Dock to stock meaning and 10 ideas to improve effective DTS processes,” December 12, 2023. Dedicated definition and later process discussion are distinguished in the coding notes. Verified September 12, 2026.
https://worldcraftlogistics.com/blog/education/dock-to-stock-meaning-and-10-ideas-to-improve-effective-dts-processes
[34] Dallas Warehouse Space, “What is Dock to Stock?,” December 10, 2024 in page metadata. Opening definition and later WMS discussion are distinguished in the coding notes. Verified September 12, 2026.
https://dallaswarehousespace.net/dock-to-stock/
[35] Oracle, WMS Cloud 25A release note, “Determine Average Dock to Stock Time Per Day using a REST API.” Shipment eligibility and exclusions; the accompanying example chart labels duration in minutes. Verified September 12, 2026.
https://docs.oracle.com/en/cloud/saas/readiness/logistics/25a/wms25a/25A-wms-wn-f36532.htm
[36] Oracle, Fusion Cloud Supply Chain & Manufacturing, Using Receiving, version 26B, “Receipt Routing.” Software-route documentation, not observed receiving-time data. Verified September 12, 2026.
https://docs.oracle.com/en/cloud/saas/supply-chain-and-manufacturing/26b/famli/receipt-routing.html
[37] Microsoft Learn, Dynamics 365 Supply Chain Management, “Inventory statuses,” updated July 1, 2026. Physical inventory and blocked availability states. Verified September 12, 2026.
https://learn.microsoft.com/en-us/dynamics365/supply-chain/inventory/inventory-statuses
[38] ShipBob Support, “ShipBob’s Turnaround Times, Policies, and SLAs,” August 10, 2026. Standard, floor-loaded, and unmatched-order receiving windows read directly from the current policy. Verified September 12, 2026.
https://support.shipbob.com/s/article/ShipBob-s-turnaround-times-policies-and-SLAs
[40] Red Stag Fulfillment, “East Coast 3PL Warehouse & Fulfillment Services.” Undated inspected page; published two-business-day service statement, not measured performance. Verified September 12, 2026.
https://redstagfulfillment.com/east-coast-fulfillment-services/
[41] Red Stag Fulfillment, “Fulfillment Service Guarantees.” Undated inspected page; as-little-as-one-hour receiving statement, not a measured average. Verified September 12, 2026.
https://redstagfulfillment.com/fulfillment-service-guarantees/
[42] OSHA, “Clarification of the Powered Industrial Truck (1910.178) standard’s use of the terms ‘in need of repair,’ ‘defective,’ and ‘unsafe,’” interpretation letter, June 17, 2004. Regulatory explanation, not additional employer obligations. Verified September 12, 2026.
https://www.osha.gov/laws-regs/standardinterpretations/2004-06-17
[43] OSHA, 29 CFR 1910.178, “Powered industrial trucks,” specifically paragraphs (p)(1) and (q)(1). Removal of unsafe trucks from service and maintenance by authorized personnel. Verified September 12, 2026.
https://www.osha.gov/laws-regs/regulations/standardnumber/1910/1910.178
[44] U.S. Bureau of Labor Statistics, Midwest Information Office, “Occupational Employment and Wages in Cincinnati — May 2025,” released July 20, 2026. Table 1, location quotients, metro definition, and technical notes; employment and wages are estimates. Verified September 12, 2026.
https://www.bls.gov/regions/midwest/news-release/occupationalemploymentandwages_cincinnati.htm
[45] U.S. Bureau of Labor Statistics, OEWS, “43-5071 Shipping, Receiving, and Inventory Clerks,” May 2022. Permanent historical occupation profile; Ohio state employment, location quotient, and highest-employment table. Verified September 12, 2026.
https://www.bls.gov/oes/2022/may/oes435071.htm
[46] U.S. Bureau of Labor Statistics, Occupational Employment and Wage Statistics Query System, May 2025 Ohio lookup. Returned a database-unavailable notice on September 12, 2026; not used to supply a numerical state estimate. Verified September 12, 2026.
https://data.bls.gov/oes/#/area/000039/2025
[47] Cincinnati/Northern Kentucky International Airport, “Air Cargo.” Airport’s stated 2023 cargo rankings and hub descriptions; the 2023 ranking is not presented as a 2026 ranking. Verified September 12, 2026.
https://www.cvgairport.com/business/business-opportunities/air-service/air-cargo/